BarnieMAT
BarnieMAT
Analysis you’ve never dreamed of before
Whenever you are evaluating your new semiconductor technology or you are bringing up your new product towards the target production yield, you need to do make detailed measurements on dozens, thousands or even millions of components and extract essential information from them. This task is particularly challenging if your product is a memory or any other array-based component like image sensors or FPGAs, where you may need to extract information from every cell. The repetitive structure of the array not only increases the data quantity by several orders of magnitude – but, to understand array effects, it is also important to detect topological relationships between the measurements.
Test and measurement equipment are able to provide huge quantity of data. BarnieMAT is a unique software tool providing all necessary functionality to transform this data into information and present it in a way that human brain can interpret. BarnieMAT users obtain faster and more reliable results with minimal effort and can focus on their decision. For this purpose, BarnieMAT provides:
• A graphical framework with strong focus on usability
• Wide range of array processing functions based on super fast algorithms and supported by an innovative filtering engine
• Configurability for any technology (large arrays, multilevel cells, 3D structure, …)
• Automation of the analysis flow using Python
• API, Python library and remote control port for iIntegration with external processing environment
• SDK for user extensions for customized processing features

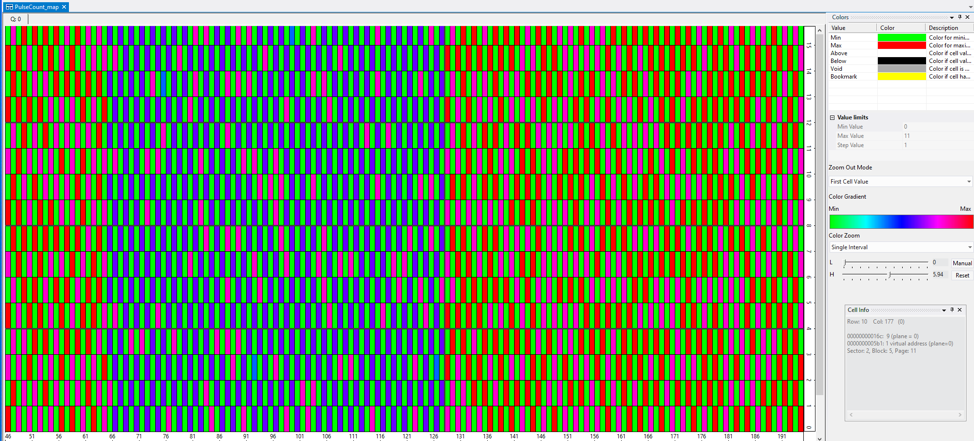
BarnieMAT Overview
Hundreds of Built-in Functions
- Conversions (map to distribution, …)
- Operations (cell-by-cell differential map, …)
- Stacking (fail count from multiple arrays, …)
- Signatures (Vt average per wordline, …)
- Overlays (block fail density, …)
- Compressions (fail count per page, …)
- Shape recognitions (list of neighbor bit failures, …)
- Trace-back (position of distribution tail cells, …)
- SQL-like table processing
Best-in-Class Presentation Tools
- Topologic view of the array data
- Measured value shown with customizable color schema
- Parallel zoom and pan on two or more arrays
- Identification and marking of critical cells on an array
- 2D and 3D distributions
- On-the-fly distribution statistics
- Wide range of charting options
Filtering for Cell Inclusion/Exclusion and Grouping
- Easy-to-learn formula for advanced processing (ex.: SPLIT=BL%2 separates cells by even and odd bitlines)
- Topologic rules (layer, bit line, wordline)
- Electrical addressing rules (segment, address, bit)
- Measurement data (selected cell, neighbor cells, another measurement)
- Combination of rules using expressions


Resources
- Articles
- Videos
Articles
Videos
Laboratories
Via Donatella 12
06132 San Martino in Campo
Perugia, Italy
06132 San Martino in Campo
Perugia, Italy
Capitale Sociale (Paid-up Capital) € 121.000,00 I.V.
Cod. Fisc. / Partita IVA (Vat Number) 00702760554
Sede CCIAA / n. REA : TR / 69772, PG / 272888
Iscriz. Reg. Imprese TR n. 00702760554
Cod. Fisc. / Partita IVA (Vat Number) 00702760554
Sede CCIAA / n. REA : TR / 69772, PG / 272888
Iscriz. Reg. Imprese TR n. 00702760554